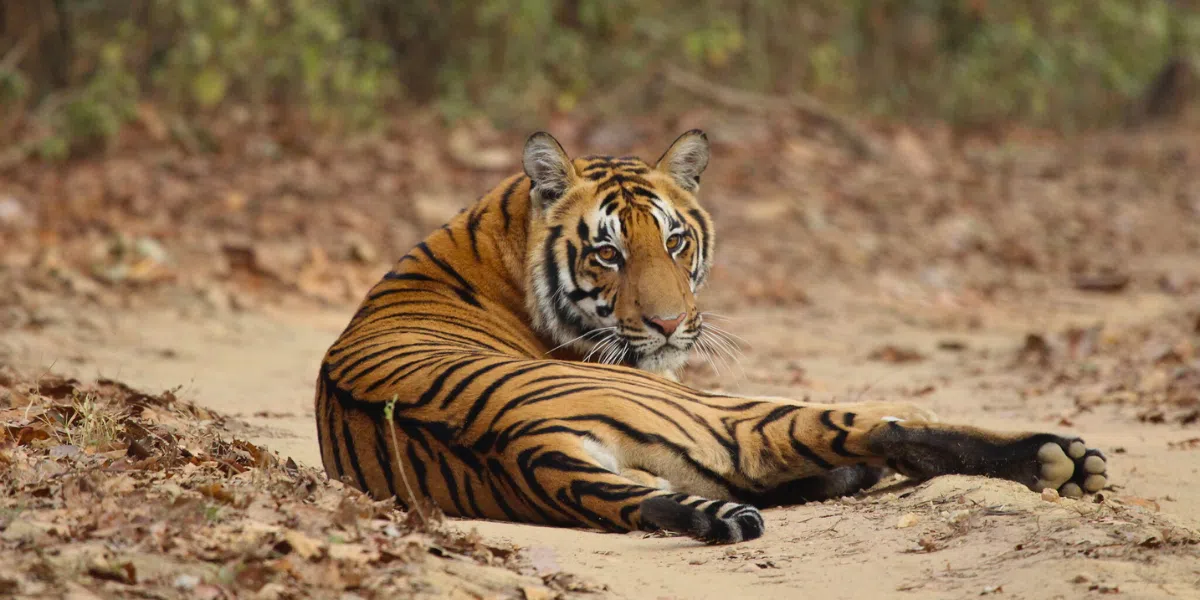
INDIA’S TIGER POPULATION THROUGHOUT THE YEARS
Lets analysis the tiger population in India through the years and how the recent Tiger Census has shownresults that are hopeful. The efforts should not stop.
- Early 1900’s – Approximately 1,00,000
- 1950’s – About 40,000 estimated
- 1970’s – Nearly 1800
- 1980’s – Around 4000 believed
- 1990’s – Approximately 3000
- Year 2006 – 1141 Tigers computed
- Year 2010 – 1706 Tigers determined
- Year 2014 – 2,226 Tigers counted
- Year 2018 – 2,967 Tigers determined
- Year 2022 – 3167 Tigers computed
The Tiger Counting of 2022, also known as the Tiger Census in India
Based on the 2022 tiger census, there are 3,682 Bengal Tigers in India. Compared to the previous Tiger Census, there has been a staggering 24% increase in the tiger population.
How is the Tiger Census conducted in India?
- The Tiger Census is the world’s biggest wildlife survey, carried out every four years.
- It takes place in 53 Tiger Reserves spanning 20 States in India.
- In 2022, about 40,000 people participated in the survey, which required an astounding 6,41,102 man-hours to complete.
- The area covered by the census was 6,41,449 square kilometres.
- 3,24,003 square kilometres of habitat plots were covered in the census.
- The tiger census has been conducted utilising the Double Sampling approach, with the forest official, guards, and forest rangers being dispatched to gather raw data using scat and leftover pugmarks in the first phase.
- At each Tiger Reserve, a First Sample is gathered by the Forest Guards following the methods prescribed by WII (Wildlife Institute of India) and the NTCA (National Tiger Conservation Authority).
- From WII, the biologists accumulated the Second Sample.
India’s Tiger Census comprises four stages
PHASE – I
- A Survey of Carnivore Signs Tigers have a home range, and within this area, they use familiar and reliable routes to navigate the jungle. The forest guards travel 15 kilometres of the trail every day. Based on past observations, established trails and indicators, and careful consideration, these pathways have been carefully chosen.
- Herbivore, Vegetation, and Human Disturbance Survey: Using a line-transect method, a 2-kilometre straight path is drawn, and any herbivores seen along the walk are noted. On the same path, this is done every morning for three days. During this census, a range finder, compass, and GPS device are used.
- Data on the density of pellets (herbivore droppings), vegetation, and any human disturbance are also noted in the vicinity of the transect line. This provides an approximation of the prey density and vegetation cover in a specific tiger’s territory or overlapping tiger territories.
PHASE – II
- The NTCA gathers information from many organisations and compiles it, from which it derives the classification of the terrain inside the Tiger’s territory. The sources of this information include
- SEDAC (Socioeconomic Data and Applications Centre) – Human Footprints
- FSI(Forest Survey of India) – Forest Maps of India
PHASE – III
- The second sample is collected by the biologists of the Wildlife Institute of India who visit Tiger Reserves.
- Based on the results of Phases 1 and 2, camera traps are strategically positioned. All passing animals are captured by these motion sensor cameras, allowing for the specific identification of each tiger and subsequent determination of its number due to its distinctive stripes.
- Scat samples are gathered in areas where camera trapping is not feasible, and a lab-based genetic study provides an estimate of the minimal number of tigers.
PHASE – IV
- The recommendations provided by NTCA specify the process for keeping an eye on and gathering data.
- Every Indian Tiger Reserve is required to oversee and carry out the yearly Tiger and Prey Census.
- Dates from the previous year are used for the current year; for the 2022 Tiger Census, for instance, data from 2021–22 was used. The Phase IV Protocol of 2021-22 is the source of this data.
- For national-level monitoring, Phase I to III are carried out every four years.

